1 October 2025 | By Niveshvani.in
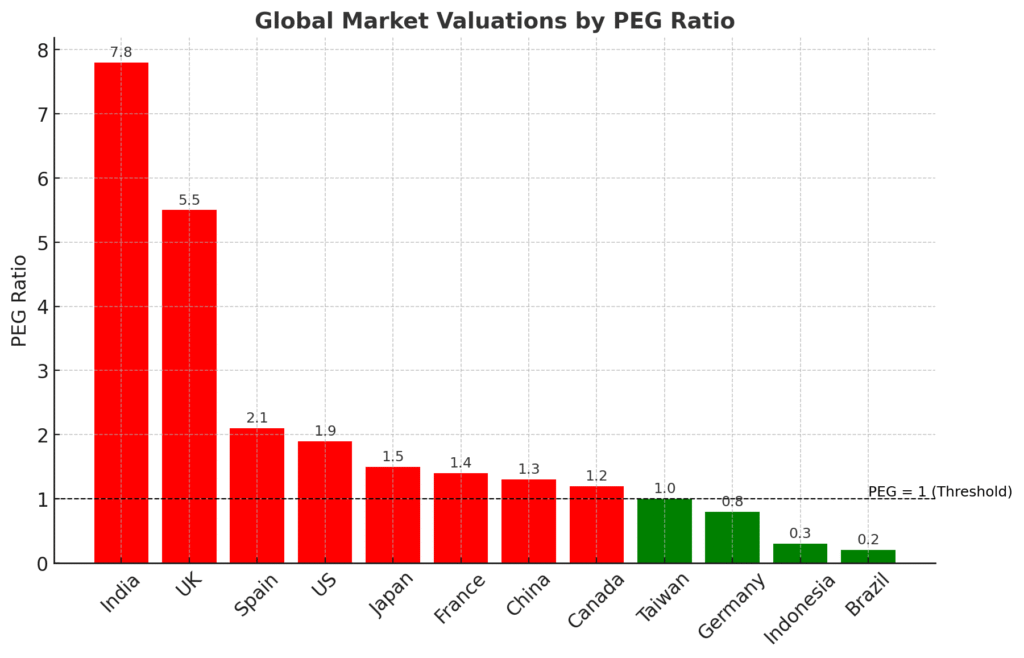
When it comes to market valuations, the Price-to-Earnings Growth (PEG) ratio offers a deeper lens into whether equities are expensive or reasonably priced. A PEG ratio above 1 is considered expensive (bad), while below 1 signals value (good).
According to data shared by Sumit Mehrotra (@SumitResearch), India currently tops the global list of costliest markets on PEG valuations, standing well above peers.
Global PEG Valuation Table
| Country | PEG Ratio | Interpretation |
|---|---|---|
| India | 7.8x | Costliest globally |
| UK | 5.5x | Expensive |
| Spain | 2.10x | Expensive |
| US | 1.90x | Expensive |
| Japan | 1.50x | Expensive |
| France | 1.40x | Expensive |
| China | 1.30x | Expensive |
| Canada | 1.20x | Expensive |
| Taiwan | 1.0x | Fairly Valued |
| Germany | 0.80x | Attractive |
| Indonesia | 0.30x | Attractive |
| Brazil | 0.20x | Most Attractive |
Infographic: Global Market Valuations by PEG
(See chart above — India leads at 7.8x, while Brazil and Indonesia are cheapest with PEG well below 1.)
Key Takeaways
- India emerges as the most expensive market globally with a PEG of 7.8x, indicating stretched valuations relative to earnings growth.
- Other developed markets like the UK (5.5x), Spain (2.1x), and US (1.9x) also trade at premium valuations.
- In contrast, emerging markets such as Brazil (0.2x) and Indonesia (0.3x) are trading at deep discounts, offering potential value for long-term investors.
- Germany (0.8x) is among the few developed markets still in the “value” territory.
✅ Courtesy: Sumit Mehrotra (@SumitResearch)